
Knowledge
The metrics to include in a post-event report
A good post-event report answers four questions: did enough people show up, was the reception smooth, did attendees take part and enjoy it, and how did ticket revenue turn out if you sold tickets. This article lists the metrics for each question, how to calculate them and where to find the numbers in Tickmi, so you can pick the right section for each reader.
Which questions should a post-event report answer?
A post-event report should answer four questions, each matched to a group of metrics. Any metric that does not help answer one of them should be left out of the report.
- Did enough people show up? The attendance group: registrations, tickets issued, check-in.
- Was the reception smooth? The reception group: peak hours, scan sources, failed scans.
- Did attendees take part and enjoy it? The engagement and feedback group.
- How did ticket revenue turn out? The revenue group, only if you sold tickets.
Which metrics should a post-event report include?
The table below lists the most commonly used metrics, with how to calculate them and where to find the numbers in Tickmi Studio. You do not need to use them all; a report for management usually needs only five or six rows.
| Metric | How to calculate | Where to find it in Tickmi |
|---|---|---|
| Attendees on the list | Total people registered or invited | Overview: Attendees card |
| Tickets issued | Tickets issued to attendees | Overview: Tickets issued |
| Attendance confirmation rate | Number of "Attending" ÷ tickets that received a confirmation invitation | Ticket list export: Attendance confirmation column |
| Attendance rate | Checked in ÷ tickets issued | Check-in statistics screen: Rate |
| Peak hour | The 15-minute window with the most check-ins | Statistics screen: Check-ins per 15 minutes; or Scan history |
| Attendance by ticket type | Checked in ÷ tickets issued for each type | Statistics screen: By ticket type |
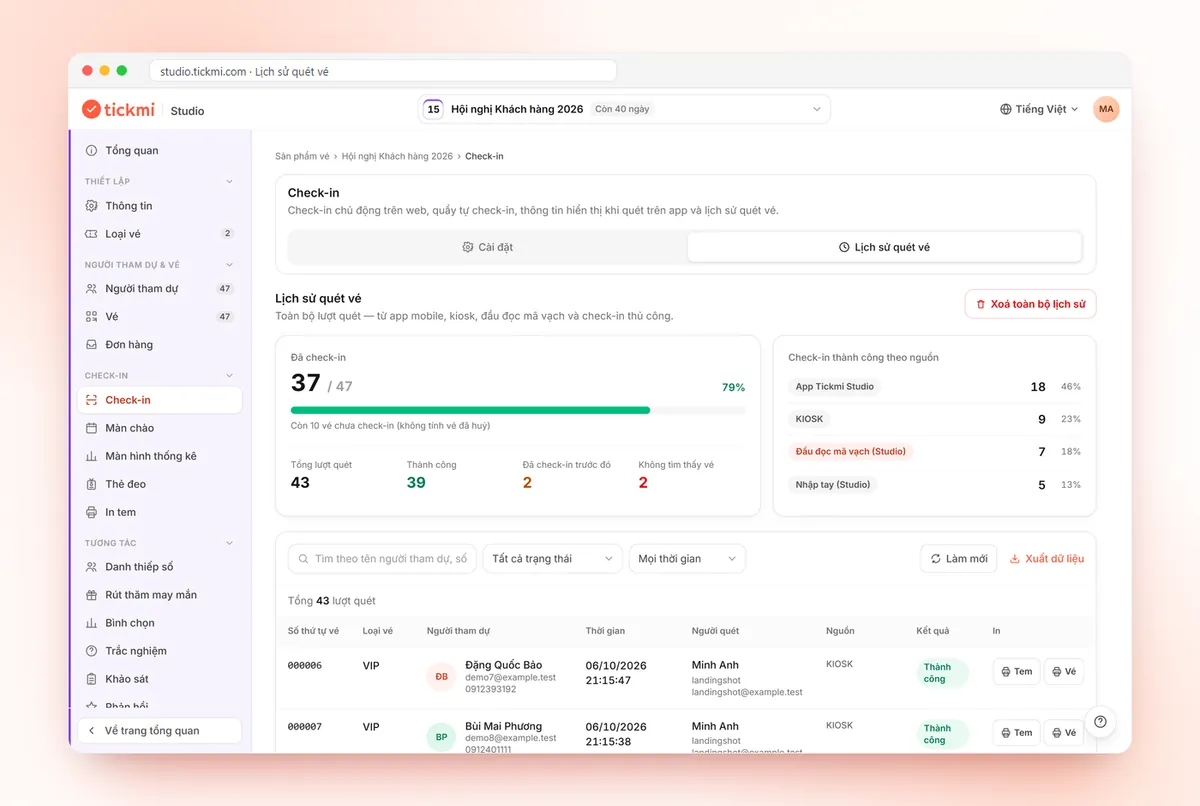
| Check-in by source | Successful scans from the app, kiosk, scanner and manual entry | Scan history: Successful check-ins by source |
| Failed scans | Already checked in + Ticket not found | Scan history |
| Attendance by group (unit, region) | Count checked-in people by custom field | Attendee list export |
| Engagement level | People who took part in polls, quizzes, surveys ÷ checked in | Engagement group: Export results, Export leaderboard |
| Satisfaction level | Average rating score; response rate = total responses ÷ checked in | Feedback: Results tab |
| Revenue (if you sold tickets) | Ticket revenue, Net received, Platform fee, number of orders, refunds | Revenue and Refunds menus |
How to read each scan source is covered in the article on reading statistics by scan source.
Which part of the report does each reader need?
Each reader needs a different part of the report, so write one shared summary and choose the appendix by recipient.
| Reader | Cares about | Metrics to put first |
|---|---|---|
| Management | Whether the goal was met | Attendance rate, satisfaction level, revenue if any, one recommendation |
| Sponsors, partners | Who they reached | Number checked in, attendance by group, engagement level |
| Operations team | What to do differently next time | Peak hours, by source, failed scans, feedback on the reception process |
| Accounting | Reconciling money | Revenue, net received, fees, refunds, order file |
Do not send sponsors a list file containing phone numbers and emails unless attendees have agreed to it. Sending aggregated numbers is enough.
How do you calculate attendance rate correctly?
Attendance rate should be calculated as the number of people checked in divided by the number of tickets issued, and the report must state the denominator clearly. Two reports using different denominators cannot be compared with each other.
A hypothetical example: 820 people registered, 800 tickets were issued (20 people were not approved), and 600 people checked in. The attendance rate is 600 ÷ 800 = 75%. If you divide by the number of registrations, the figure becomes 73%, which looks almost the same but is not the same definition.
- Exclude test scans: test scans are recorded like real ones. Set test tickets back to not checked in before taking the numbers.
- Count people, not scans: for a multi-day event, one ticket may be scanned several times. The Checked in box counts tickets, while Scan history counts scans. See also the article on multi-session, multi-day events.
- Compare with yourself: an invitation-only event usually has a different rate from a free open-registration event. Compare against previous editions of the same type of event.
To improve this number next time, read the article on increasing the rate of registrants who actually attend.
In what order should you pull data from Tickmi Studio?
Pull numbers from the overview down to the details, and export the files right after the event while the data is intact. A suggested order:
- Ticket product overview: attendees, tickets issued, checked in, ticket creation and sending progress.
- Check-in statistics screen: rate, by ticket type, peak hours. The 15-minute chart only keeps the most recent 8 hours, so take a screenshot as soon as the event ends. See the check-in statistics screen guide.
- Scan history: by source, failed scans; click Export data.
- Attendees: click Export data to get a file by ticket type, registration source, custom fields and check-in time. Only the organization Owner and Administrators can export.
- Engagement group: export poll and survey results and quiz leaderboards, and view feedback scores.
- Revenue: if you sold tickets, view the figures and export the orders to Excel. See the guide to revenue, reconciliation and refunds.
A schedule and a one-page report template to send within the same day are in the article on the 24-hour wrap-up report.
Data checklist before sending the report
- Every rate states its numerator and denominator.
- Test scans and test engagement data have been removed.
- The checked-in number in the report matches the Overview.
- A screenshot of the peak-hour chart has been saved.
- The part sent to partners contains only aggregated numbers, no personal data.
- There is at least one concrete recommendation for next time.
Common mistakes when writing a post-event report
- A report that is all numbers with no conclusion. Each table should have a one-sentence "so what".
- Mixing up scans and people. Total scans include failed scans and repeat scans.
- Pulling numbers too late. The 15-minute chart only shows the most recent 8 hours; tickets may also have been edited after the event.
- Ignoring negative feedback. Low-score comments are where the things to fix are. How to collect feedback is covered in the article on thank-you emails and post-event surveys.
An overview of check-in and real-time figures is on the check-in software page.
About Tickmi
Tickmi is a ticketing and attendee experience platform (Ticketing & Participant Experience Platform). On one unified set of attendee data, Tickmi connects the whole journey: issuing invitation tickets, registration tickets and paid tickets, sending branded QR tickets, checking in by app, kiosk or scanner — even when the network is down — and then the welcome screen, lucky draw, polls, quizzes and surveys. Tickmi is trusted by organizations such as Viettel, VNPT, MobiFone, FPT and CMC. Learn about Tickmi or try it free.
Frequently asked questions
Which metrics does a post-event report include?
Four groups: attendance (registrations, tickets issued, checked in, attendance rate), reception (peak hours, scan sources, failed scans), engagement and satisfaction (polls, quizzes, surveys, feedback scores), and revenue if you sold tickets.
How is attendance rate calculated?
Divide the number of people checked in by the number of tickets issued. For example, a hypothetical 600 check-ins out of 800 tickets issued is 75%. Always state the denominator so that editions can be compared.
What is a good attendance rate?
There is no universal figure. Invitation-only events and free open-registration events have very different levels. Compare against previous editions of the same type of event.
Can I export the figures to Excel?
Yes. In Tickmi, the attendee list, scan history, poll results, surveys, quiz leaderboards and orders can all be exported as files. Only the Owner and Administrators can export the attendee list.
Do I need to send the attendee list to sponsors?
Usually not. Send aggregated numbers such as the number checked in and attendance by group. Share personal data only when attendees have agreed to that purpose.
Issue QR tickets, send emails, check in and engage attendees on one platform.