
Knowledge
Post-event summary report for your boss in 24 hours: a 1-page template and where the numbers come from
Your boss does not need a 20-page slide deck after the event. They need one page that answers three questions: did we hit the goal, what stood out, and what will we do differently next time. This article gives you a one-page report template, shows where each number lives in Tickmi, and points out the mistakes that skew the figures.
A 1-page summary report template: readable in two minutes
One page is enough when each block answers just one question. The template below works for conferences, launch events, year-end parties and training sessions.
| Block | The question it answers | Suggested content |
|---|---|---|
| 1. One-line conclusion | Did the event meet its goal? | One sentence with numbers: "[X] people attended, equal to [Y]% of issued tickets" |
| 2. Attendance | Who showed up? | Tickets issued, number checked in, rate, split by ticket type |
| 3. Reception | Was entry smooth? | Peak hours, estimated wait time, incidents if any |
| 4. Engagement | Did attendees take part? | Number of votes, quiz scores, rating scores |
| 5. Revenue (if tickets were sold) | How much money came in? | Revenue, net received, number of orders |
| 6. Lessons and recommendations | What do we do differently next time? | 3 things to keep, 3 things to change, with reasons |
Pruning rule: if a number does not help your boss make a decision, move it to an appendix. For example, the total number of scans matters less than the share of ticket holders who actually showed up.
Where to find the numbers in Tickmi Studio
For an event run on Tickmi, almost every block above has a ready source. This table links each block to the right screen.
| Metric | Where to find it | Note |
|---|---|---|
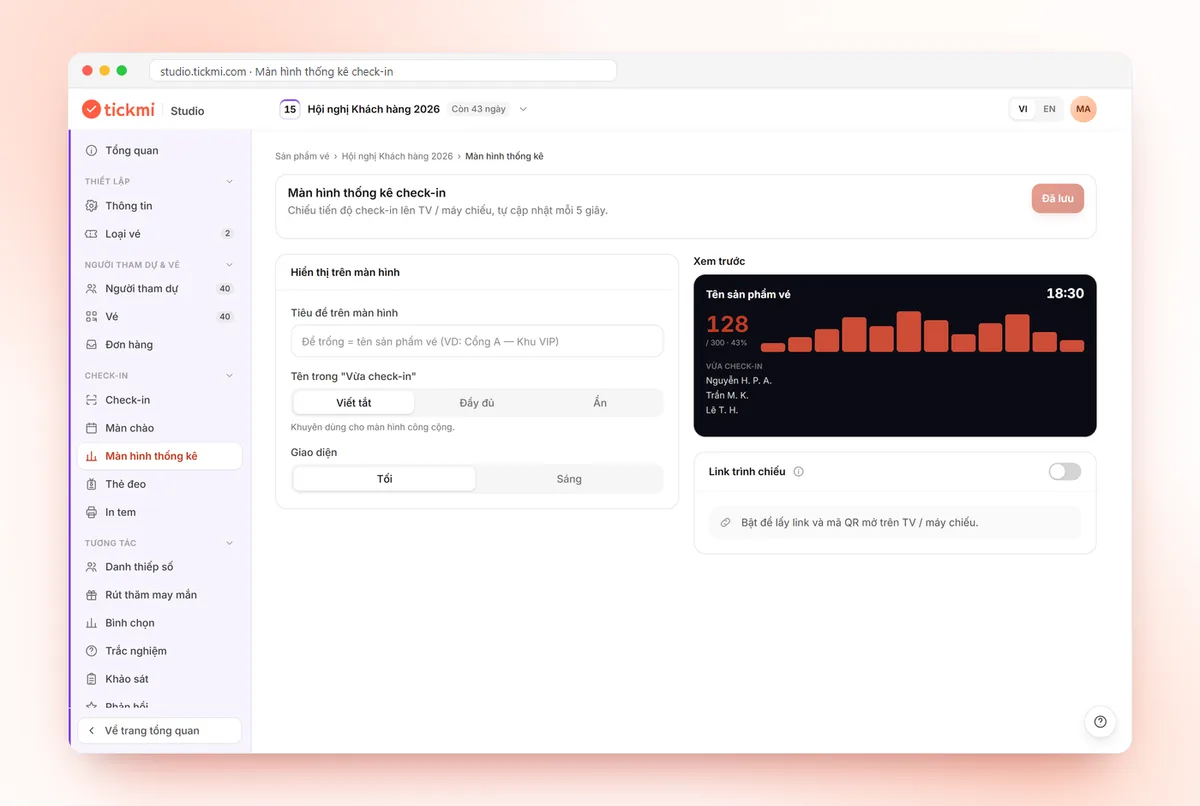
| Checked in, Total tickets, rate, number not yet checked in | The Check-in statistics screen tab of the ticket product | Total tickets is based on tickets issued, not on registrations |
| Progress by ticket type | The By ticket type block on the same screen | Use it for sponsor reports and VIP groups |
| Peak hours | The Check-ins per 15 minutes chart | It only shows the last 8 hours up to the current time, so capture it during or right after the event |
| Attendee list | The Export data button on the attendee list | Only the Owner and Admins can export |
| Votes, surveys | Results tab, Export results button | Export before you click Delete all entries |
| Quiz scores | Leaderboard, Export leaderboard button | Includes scores and submission time |
| Rating score, number of responses | Feedback section: Average rating, Total responses | You need to collect feedback within 1 to 2 days afterward, see below |
| Revenue, net received, number of orders | Revenue menu | Counted by payment time; orders can be exported to Excel |
The check-in count on the statistics screen combines all sources: app, kiosk, barcode reader and web check-in. For detailed instructions, see the check-in statistics screen and revenue, reconciliation and refunds.
A 24-hour schedule to get the report out on time
Work to fixed times rather than "whenever I have a moment". The hypothetical example below assumes the event ends at 5:00 PM:
- While the event is still running (or right when it ends). Open the check-in statistics screen and take screenshots of the peak-hour chart and the final rate. The chart only looks back 8 hours, so do not leave it until the next day.
- That evening. Export the vote results, the quiz leaderboard and the list of prize winners if any, and save them in a shared folder. These are the originals for cross-checking.
- The next morning. Fill blocks 1 to 5 of the template. Send a thank-you email with a quick survey, aiming to receive responses before the afternoon.
- Early afternoon. Add the response numbers, write the lessons block, read it through once and send. Ask a colleague to cross-check the numbers.
How to write the thank-you email and survey is covered in thank-you emails and surveys after an event. If you need a broader list of metrics than this template, see the metrics to include in a post-event report.
Hypothetical example: one right conclusion line and one wrong one
The wrong line: "The event was a great success and was enthusiastically received." There is nothing to verify.
The right line (numbers are entirely hypothetical): "420 tickets were issued and 336 people checked in (80%). Entry peaked from 8:00 to 8:30 with no queue problems. The average rating was 4.3/5 from 112 responses."
What matters in the right line is that the denominator is stated: the rate is calculated on tickets issued, not on registrations. Always state the denominator, because the same event can produce two different rates depending on how you calculate it.
Common ways the numbers get skewed
- Test scans counted as real ones. Test scans made before doors open are recorded in the history as real scans. If you test-scanned real attendees' tickets, use Mark as not checked in in the attendee list to restore their previous status.
- Wrong denominator. Total tickets is the number of tickets issued. If you issue more tickets after the event, the rate will change. Fix the time at which you take the numbers and record it in the report.
- Lumping in late arrivals. People who check in close to the end time still count as attended. Agree with your boss beforehand on what "attended" means.
- Taking numbers from an old screenshot. The numbers on the display screen update continuously. Every figure in the report should carry the time it was taken.
- Sending the exported file to many people. The list file contains personal data. Send only the summary to your boss and keep the original in a folder with access controls.
- Mixing revenue with reconciliation. Ticket sales revenue and the amount actually received after fees are two different numbers. State clearly which one you are reporting.
Checklist before you hit send
- The conclusion line has at least one number and states the denominator.
- Every number has a source and a time taken.
- No paragraph consists only of adjectives.
- The lessons block has concrete actions for next time, not "needs improvement".
- You have opened the report once in print mode to make sure it fits on one page.
If you want reception numbers ready the moment the event ends, switch on the check-in system from the start. For an overview, see Tickmi's event check-in software page; how to measure with the statistics screen is in the guide referenced above.
About Tickmi
Tickmi is a ticketing and participant experience platform. On a single, unified set of attendee data, Tickmi connects the whole journey: issuing invitation, registration and paid tickets, sending branded QR tickets, checking in with an app, kiosk or scanner (even offline), and then moving on to the welcome screen, lucky draw, polls, quizzes and surveys. Tickmi is trusted by organizations such as Viettel, VNPT, MobiFone, FPT and CMC. Learn about Tickmi or try it free.
Frequently asked questions
How long should a summary report for my boss be?
One page is enough for most events. Put a conclusion with numbers at the top and move the details to an appendix so your boss can read deeper if needed.
Can I view the hourly check-in chart the next day?
The check-ins per 15 minutes chart only shows the last 8 hours up to the current time. So capture it during or right after the event, before you write the report.
Who can export the attendee list for the report?
Only the organization's Owner and Admins have the Export data button. Check-in staff cannot export, so ask someone with permission when you need the original file.
What is Total tickets on the statistics screen based on?
It is based on the number of tickets issued for the ticket product, not the number of people who registered. State this denominator in your report so the attendance rate is not misread.
How do I get vote and survey data for the report?
In the Results tab of each item, click Export results (for a quiz, Export leaderboard). Export before you click Delete all entries, because deletion cannot be undone.
Issue QR tickets, send emails, check in and engage attendees on one platform.